This chapter analyzes CPMM data collected throughout 2020 and reports the latest TFIs for both road and rail transport at selected BCPs8 and along the CAREC corridors.9 It provides an overview of the regional and local developments in the CAREC region, followed by a performance evaluation of the four TFIs and the six CAREC corridors.
Road Transport
Analysis of 2020 CPMM data showed that all four TFIs performed below the estimated levels in 2019. Both border-crossing time and cost increased, as well as total transport cost, while speeds were slower too. The disruptions caused by the coronavirus disease (COVID-19) pandemic resulted in temporary border closures, longer inspection times due to more stringent controls after border reopening, and difficulty in consolidating freight and locating drivers, which compounded the difficulties faced by transport operators. Detailed results are presented in Chapter 4.
Trade Facilitation Indicator 1: Time Taken to Clear a Border-Crossing Point. Figure 2.1 shows that border-crossing time averaged 15.1 hours in 2020, a sizable increase from 12.2 hours in 2019. The long-term median also increased steadily in recent years. For outbound traffic, Chaman and Torkham, two BCPs in Afghanistan and Pakistan, as well as Kuryk11 (a seaport at the Caspian Sea), continued to report long border-crossing delays. In Uzbekistan, inbound traffic at Yallama and Saryasia reported high costs. Stringent controls at these BCPs led to significantly longer border-crossing time.

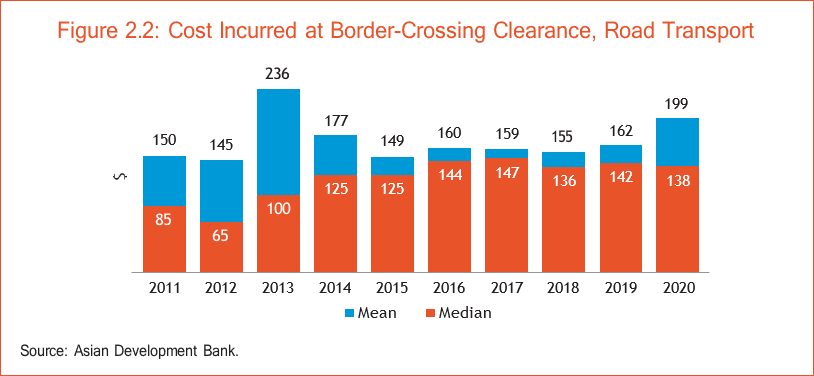
Trade Facilitation Indicator 2: Cost Incurred at Border-Crossing Clearance. The average border-crossing cost was estimated at $199 in 2020, an increase from $162 in 2019 (Figure 2.2). The People’s Republic of China (PRC) BCPs reported distinctly higher border-crossing costs, such as Alashankou, Horgos, and Takeshikent. Horgos–Nur Zholy (PRC–Kazkhstan [KAZ]) was particularly costly to cross. Other notable locations included Torkham and Shirkhan Bandar, both located along Corridor 5. The increase in border-crossing cost was driven by the additional health and quarantine payments after border authorities imposed stricter controls such as mandatory temperature scanning and COVID-19 testing at the border for national and foreign drivers before their entry into the country.

Trade Facilitation Indicator 3: Cost Incurred to Travel a Corridor Section. Total transport cost to travel a corridor section averaged $917 in 2020, up from $901 in 2019. The estimated cost on subcorridor12 1b reached $2,251, in part driven by the elevated border-crossing cost at Horgos BCP at the PRC side. In subcorridor 5b, the estimated average cost reached $4,755, attributed to higher road freight rate for that section (Figure 2.3).

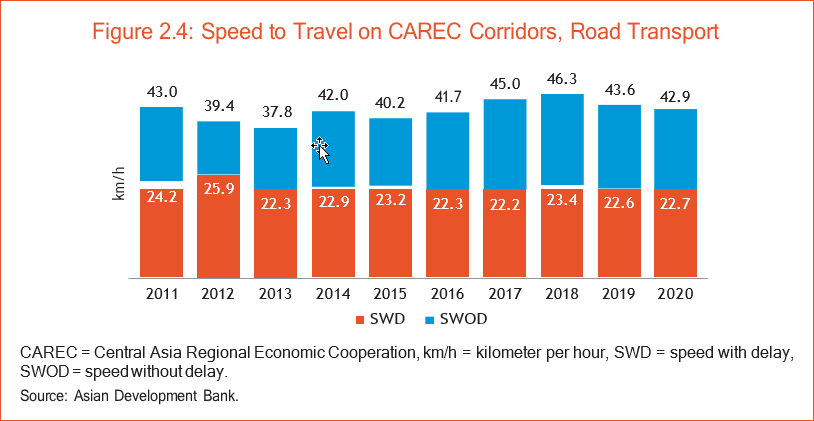
Trade Facilitation Indicator 4: Speed to Travel Along CAREC Corridors. Trucks registered an average SWOD of 42.9 km/h, down from 43.6 km/h in 2019; SWD remained relatively unchanged at 22.7 km/h. Corridor 1 was the fastest, while Corridor 5 was the slowest. Overall, the gap between SWOD and SWD remains large indicating considerable impediments largely attributed to border procedures (Figure 2.4).

Rail Transport
Reversing its positive trend since 2014, the average time to clear a BCP, cost to travel a corridor section, and SWOD and SWD estimates all declined in 2020. In addition, the average cost to clear a BCP continued its downward trend since 2015. Detailed results are presented in Chapter 5.
Trade Facilitation Indicator 1: Time Taken to Clear a Border-Crossing Point. Rail transport averaged 23 hours to complete border crossing, up from 20.6 hours in 2019. Corridors 1 and 3 reported an increase. Main reasons for delays include the surge in express container trains (which were given higher priority than conventional trains thus compelling the latter to wait longer at the borders), road to rail modal shift, and extra sanitization steps to control the spread of COVID-19. The multitude of factors created congestions at some parts of the rail network, and bottlenecks emerged at break of gauge BCPs like Alashankou–Dostyk. However, Figure 2.5 shows a divergent pattern between mean and median in 2020, which implies the presence of extraordinarily long delays in 2020.

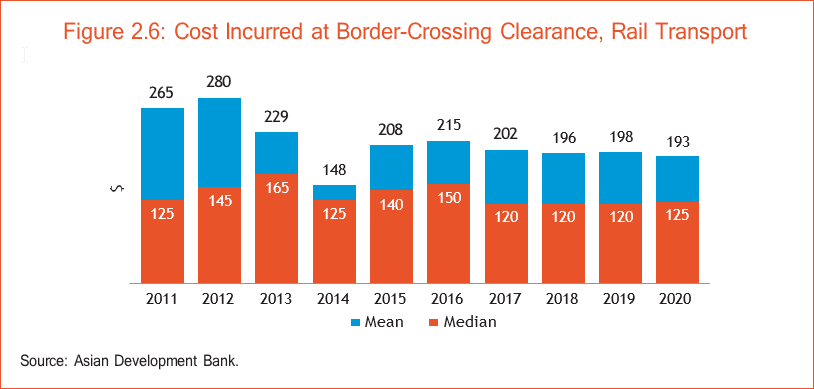
Trade Facilitation Indicator 2: Cost Incurred at Border-Crossing Clearance. The average border-crossing cost dipped slightly from $198 in 2019 to $193 in 2020. Corridor 1 showed an increase, which was negated by decreases in Corridor 3 and 4 (Figure 2.6).

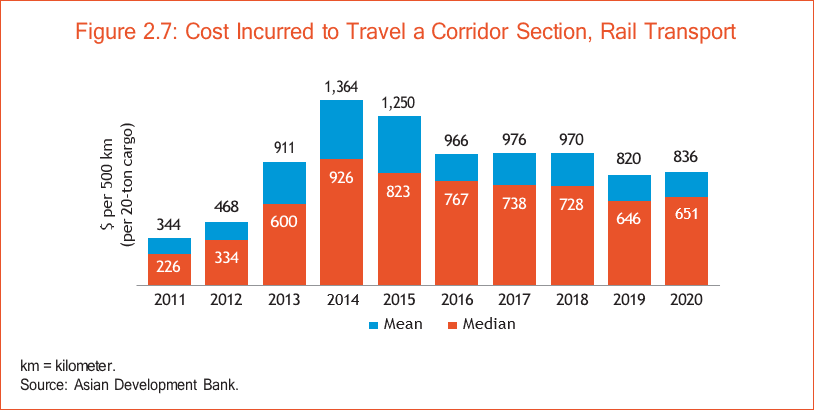
Trade Facilitation Indicator 3: Cost Incurred to Travel a Corridor Section. Figure 2.7 shows total average transport cost increased from $820 in 2019 to $836 in 2020, while the median values also increased. Rail freight rates (per 20-ton and 500 km) averaged higher in Corridors 4 and 6 compared to Corridor 1. TFI3 is anticipated to increase in 2021 as most, if not all, of the express container train subsidies by the PRC government to train operators will be eliminated,13 which will in turn cause the transport rates to surge. In addition, a huge spike in ocean and air rates in the last quarter of 2020 has allowed some express container train operators to raise their freight rates by almost 50%.

Trade Facilitation Indicator 4: Speed to Travel on Central Asia Regional Economic Cooperation Corridors. Speed without delay dropped from 45 km/h to 42.2 km/h, and SWD from 19.0 km/h to 16.8 km/h, as shown in Figure 2.8. All corridors reported slower speeds in 2020 as rail transport attracted more freight during the pandemic, causing congestion and longer processing times. Disinfection also added to the delays at BCPs. The Alashankou–Dostyk BCP suffered from periodic bottlenecks, forcing China Railway to embargo regular cargo trains to Alashankou several times. Even though express container trains were not embargoed, the border processing time increased. To relieve the Alashankou–Dostyk congestion, Chongqing–Moscow trains were diverted to the Manzhouli–Zabaikalsk BCP14 for direct connection with Russian Railways (RZD), which is a substantially longer and circuitous route. However, unlike the Chongqing–Alashankou–Dostyk–Moscow route, the Chongqing–Manzhouli/Zabaikalsk–Moscow route is not part of a CAREC corridor, hence shipments are not monitored under CPMM.

